
A few years ago I stumbled upon the now-notorious (I think) site detailing the “Aphex Face,” a picture of Aphex Twin embedded in one of his songs (track 2 on the Windowlicker single). Basically if you don’t want to read the site, a guy was watching the song on a spectrum analyzer and saw this face pop up a few tweaks later and it was clear as day – and creepy as hell. I thought it was cool at the time but never really thought about it.
Lately, a friend of mine and I became interested in it again because we were messing with sounds and making scary little tracks from playground noises. We needed a way to create cool noises and the idea of turning an image into sound seemed esoteric and appealing. I had shown him the Aphex face and we wanted to do something like that. We searched around and it became evident that he had used a Mac-only program called Neurosis or something – I can’t find it now. We were discouraged at first but soon found a Windows equivalent called Coagula. The best spectrum analyzer I could find is a professional-grade tool called SpecLab. This thing is for some seriously scientific stuff. With SpecLab, Coagula Light 1.6, and MSPaint at our disposal, we began messing around in earnest. Our aim: to reconstruct in the spectrum analyzer a picture from my hard drive. Unfortunately it is not as easy as all that: both programs are complicated and powerful, and default settings weren’t going to do it for us.
Here’s a breakdown of the software. You know you always see the little graph in your Winamp or stereo that looks like a little equalizer with the bars going up and down? (Sorry, it sounds like I’m explaining this to a baby). That’s a basic spectrum analyzer. SpecLab is basically a histogram of that thing, though much more precise. You give it the range and update rate, and it keeps a record of exactly how loud the sound was in each frequency, down to a single Hz and many fractional levels of dB. So every 50 milliseconds, if that is the duration you choose, it will assign a value to each frequency based on the amplitude of that frequency in the sound at that moment. It looks up that value in a palette (color or greyscale) and writes the color specified to the screen at the frequency’s location on an axis. The result is basically what you see on your stereo except instead of height to show the amplitude, it uses color. Then, at its next update point, it does it again and places the next pixel-wide record next to the first. Once a lot of these get lined up, you can really see a record of the sound in progress. It’s really very fascinating to watch, and to look at a whole song as a single object is a real paradigm shift, to use the cliché.
Coagula basically does the same thing in reverse. The picture is divided into single-pixel slices vertically, and in Coagula the white value of each pixel in the slice is converted to a component of the resulting sound. The value is coded as amplitude, the position of the pixel as frequency. Thus, a white point at the top of the picture will be a moment of loud, high-Hz pure tone. A dark point at the bottom will be a quiet, low-Hz tone. Add a bunch of these together and you’ve converted the slice to a moment of sound. Add the slices together and you get a longer sound, representing the whole picture. The only problem is getting the spectrum analyzer to match the output settings of the sound renderer.
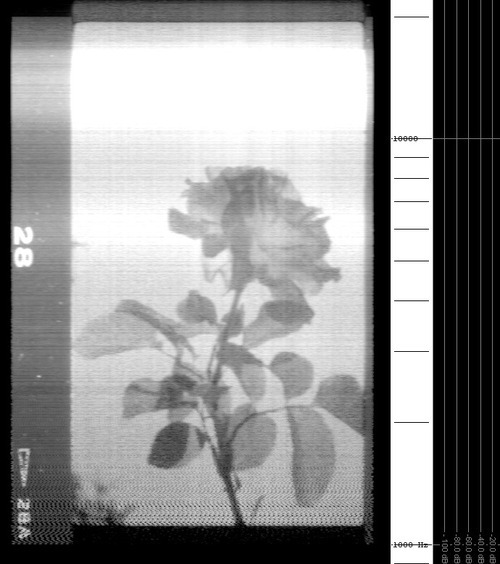
We began with a scan of a negative from a roll i took, a rose with the sloppy edges included. Our first creation was about a minute long, and sounded for the most part like a rising wind blowing through some trees. At the beginning and end of the sound were sudden explosions of white noise. Running this through SpecLab, we found we had an extremely elongated rose, choppy at the bottom and generally out of focus. We shortened the length of the sound rendered from the scan and increased SpecLab’s sample rate. Now the rose was correctly proportioned, but it was still fuzzy and seemed to be getting shredded at the bottom. we found that we had to increase the frequency range of the sound generated (we now go from about 1000 to 20,000 Hz) and adjust a few more settings. Now, the rose was uniformally fuzzy at all levels. Next we began noodling with settings, and found that by reducing the “noise something” from 5 to 1, we achieved a sound which was amazingly sharp, but also immeasurably abrasive to the ear. It sounded more like Aphex’s sound, though, so we more or less had it at this point. From then on it was all about tweaking the display config of SpecLab to get the best contrast and resolution – we run it at about 30ms update rate with sounds around 20 seconds long now. Inverting the picture is optional, depending on whether you want to create a picture or a good sound (lots of white makes for a noisy sound) You can make out the letters and read, with some difficulty, the text written on a painting that Mike did. The rose pic here is ok but we had a better one from a better source; I just whipped this one up for the site. Here’s the sound we ended up with for the rose (mp3 file).
It also occurred to us that we didn’t have to use a scanned picture – this was extremely limiting in fact. Photos have lots of grey, which results in a large amount of background noise, and can obscure the details of the picture. We began drawing stuff – since Coagula uses black as blank (no sound), we drew shapes, lines, text, all sorts of things, inverted the colors and then ran them through. A limitation we discovered was that colors are irrelevant – though they may result in different noises in Coagula, that is because of arbitrary distinctions by that program’s creators. In order to reproduce color through a sound, there would have to be absolute agreement between the producer and the interpreter of the sound. That is unlikely as there are many palette sets, contrast settings, and other stuff for SpecLab and for any decent spectrum analyzer. Since the image is encoded as basically two pieces of information (frequency and volume), a color code would be incredibly hard to work out, and would also sound like total nonsense.
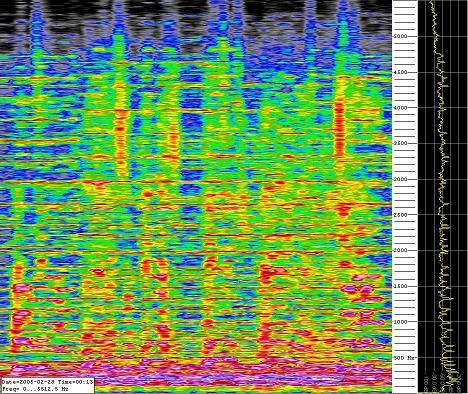
As an experiment, I set SpecLab to do a screen capture every minute and put on a song. I chose the opening track of the Secret Machines’ first album because I love how it looks on this thing (I’ve watched it before). I put the screencaps together (took a little MSPaint elbow grease) and made this picture, which I am enormously pleased with (full size here):
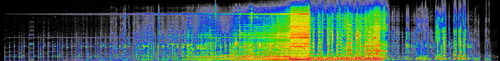
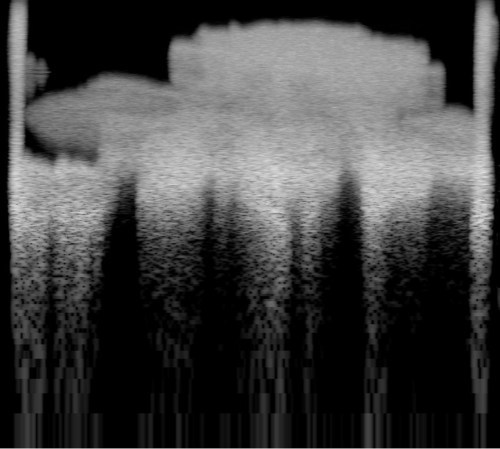
As you can see, with the right settings SpecLab can create fascinating and beautiful images, depending on what you put into it. You can see where the distortion kicks in, as well as the kick drum and high hat after that. Voice covers a large amount of frequencies and is very dynamic so it is kind of like furry columns. I’ve watched a few songs on this thing and almost all are unique and very pretty. Drone-y stuff is like a big colorful sea or cloud , guitar pop is complicated-looking with lots of different things going on, and so on.
With Coagula we’ve tried drawing chords – I copied a guitar lick from a screencap and pasted it at different levels, it worked kinda all right but its probably easier to just play a guitar. Various geometric shapes sound different – squares are ranges of pure tones, circles have a strange frequency fading effect, and empty shapes are especially weird. Since a line only produces a sound at a single frequency or a very limited range of them, it is kind of like playing a synthesizer. Text sounds bizarre, spray can sounds like limited range white noise, and so on. We made a long, ultra-low-frequency sound by just drawing it and controlling for frequency, and added a sibilant kind of beat with thin, tall rectangles. Since you are creating the sound without the things that make things sound organic, like dynamic range, higher level vibrations, and other things, most of what I draw sounds like lasers (that sound is hilarious…) but I am only beginning to experiment. I hope that a few people read this and experiment with it – you can send me a song that is just a 35kb jpeg! It’s really a profoundly strange experience, and I’ve since begun visualizing the sounds around me on a regular basis. The idea that most sensory experiences are merely data, and simple, mutable data at that is a foreign one for most people, but it’s hard not to learn when you’re working with this kind of cross-modal software.
Coincidentally, I just [in 2005] wrote a short paper on Synesthesia, a rare (or maybe not?) neurological condition in which a person sees auditory stimuli as visual percepts (in addition to hearing them) – or a number of other sensory mix-up variants. Some people see every letter, number, and word as a different color. It’s like you’ve got SpecLab in your head. You can read about synesthesia in my paper (not too technical) or at one of the many resources and reviews of literature online.